Fragment Formula Calculator
Home
Motivation: The accurate determination of mass isotopomer
distributions (MIDs) is of great significance for stable isotope
labeling experiments. In the context of gas chromatography/mass
spectrometry (GC/MS) chemical formulas usually form the basis of
MID calculations for specific ions. Hence, the correct assignment
of chemical formulas to fragment ions is of crucial importance for
correct MIDs. However, the process of mass spectral fragmentation
is complex and assigning chemical formulas to mass spectral ions is
non-trivial. For that reason, we developed a novel approach, based
on a systematic bond cleavage, to calculate chemical formulas for
GC/MS fragment ions.
Results: Here, we present a novel algorithm implemented in a an
easy to use graphical user interface that can calculate chemical
formulas for fragment ions where the structure of the molecular ion is
known. The proposed algorithm is able to cope with general molecular
rearrangement reactions occuring during GC/MS measurements.
As input, Fragment Formula Calculator (FFC) needs the 2D structure
of the molecular ion together with the measured mass spectrum. This
data can be loaded manually (from a MOL and csv file) or directly
from an SQLite database.
We tested the predictive capabilities of our programm for mass
spectral ions of several amino acids where the fragmentation
has been published previously for t-butyldimethylsilyl (TBDMS)
derivatization (Antoniewicz, 2006).
Availability: FFC is C++ and Qt4 based, and freely available under
an open-source license. Precompiled packages for the installation on
Debian- and Redhat-based Linux distributions as well as Windows
operating systems, along with data, are provided for download at
www.ffc.lu.
Downloads
- FFC Windows 64bit 32bit
- FFC Linux (debian installer package) 64bit 32bit
- Documentation pdf
- Sample data TMS TBDMS
Documentation
FFC Documentation
Andre Wegner, Daniel Weindl, Sean Sapcariu, Gregory Stephanopoulos, Karsten Hiller
July 2013
This document provides a basic overview of the FFC program. It contains both a user manual for the program as well as a step- by-step tutorial using sample data available on the website.
Contents
|
2 |
|||
|
2 |
|||
|
|
2 |
||
|
|
3 |
||
|
|
4 |
||
|
|
4 |
||
|
|
5 |
||
|
|
6 |
||
|
8 |
|||
|
|
8 |
||
|
|
8 |
||
|
|
9 |
||
|
|
10 |
||
|
11 |
|||
1 Introduction
Electron impact ionization mass spectrometry measurements lead to complex mass spectra, caused by the partial fragmentation of the analyzed compound. For the calculation of mass isotopomer distributions (MIDs) from stable isotope labeling experiments, the chemical formula of the specific fragment ion must be known. However, the process of assigning a structural formula to a fragment ion from a known molecular ion structure is difficult. FFC is a Qt4 based software package that implements an novel algorithm for the calculation of chemical formulas for fragment ions where the structure of the molecular ion is known. This algorithm is speci cally designed for MS data with nominal masses (such as from quadrapole instruments), and is based on combinatorics, thus requiring no a priori knowledge of fragmentation mechanisms. The combinatorial approach also allows this algorithm to be universally applied for the calculation of chemical formulas, providing a distinct advantage over rule-based approaches. FFC is freely available under an open-source license, and can be used on both Windows and Linux operating systems.
2 User manual
2.1 Installation
The FFC package can be downloaded from http://ffc.bioinfo.nat.tu-bs.de for Linux (deb or rpm) and Windows (32 and 64 bit versions are available)
2.1.1 Linux
Open a terminal and change to the directory containing the downloaded file. Then type the following in the command line:
rpm -i filename for rpm based systems
sudo dpkg-i filename.deb for Debian based systems
where filename is the name of the deb or rpm file (e.g ffc-1.0-Linux.deb).
2.1.2 Windows
Start the windows installer and follow the instructions.
2.2 Graphical user interface (GUI)
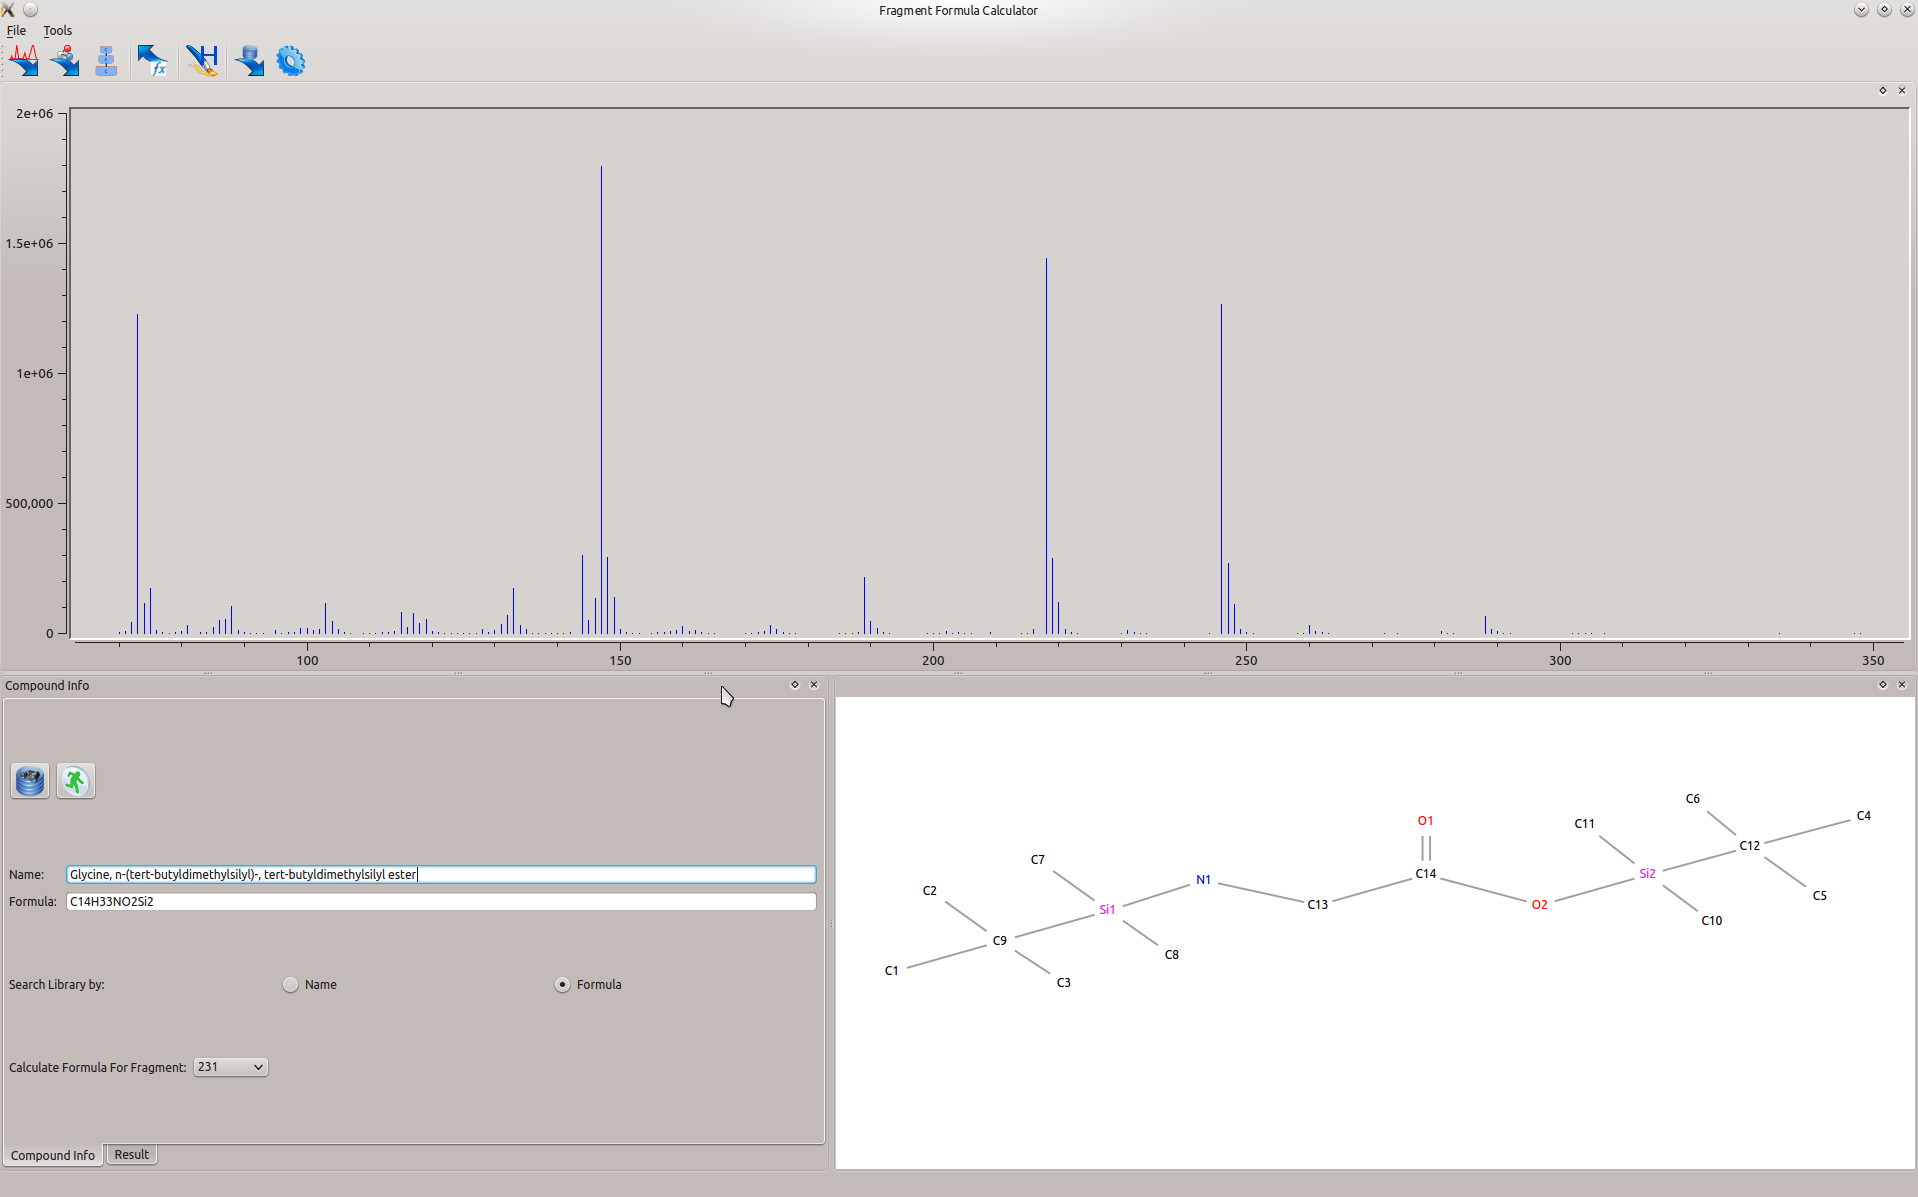
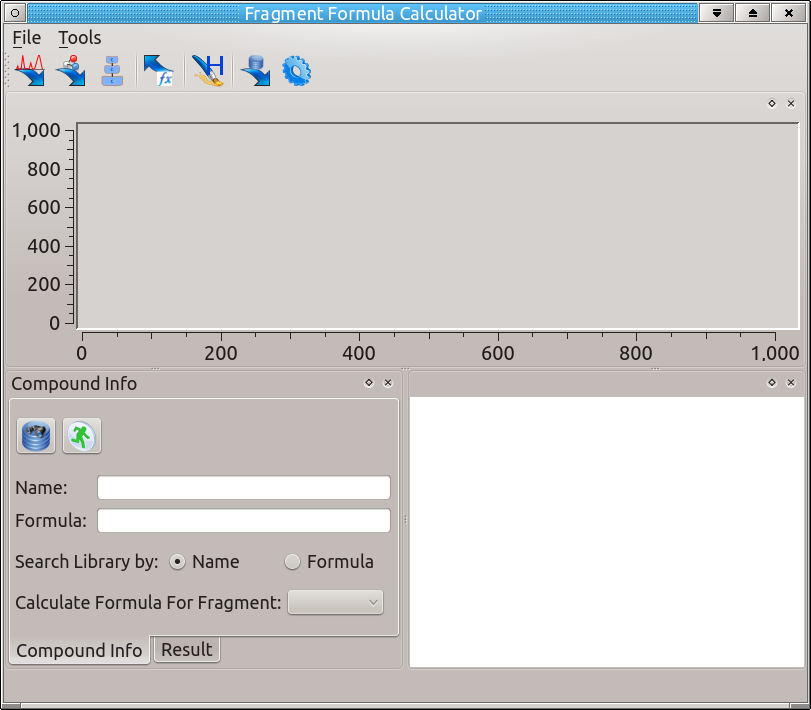
The graphical user interface (Figure 1) is organized in one main window containing three subwindows.
2.2.1 Spectrum window
This window (in the upper part of the main interface) displays the loaded spectrum. The x-axis is m/z values, and the y-axis is the intensity. By clicking a dragging the mouse, you can zoom in on specific parts of the spectrum. To zoom out, right click on the window.
2.2.2 Compound Info Window
This window (in the bottom left of the main interface) contains the compound of interest for fragment calculation. In the 'Compound Info' tab, you can search for a compound by either name or formula, as long as a library has been chosen in the settings. If a spectrum has been loaded (either by searching a database or by importing), here the user can choose the compound fragment to calculate the formula for. After calculation of the formula, the 'Result' tab contains the calculated formulas for the compound of interest at the corresponding sized fragment.
NOTE: If a mol file and a spectrum have been imported by the user, there is no need to fill in the fields here. The formula for a desired fragment can calculated anyways.
2.2.3 Result Visualization Window
This window (in the bottom right of the main interface) displays the chemical structure of the compound of interest.
2.3 Settings
The settings can be reached by either clicking on the icon  or by choosing 'Settings' from the 'Tools' menu.
Library - Sets the active library for use with the program.
Max Cut Size - Sets the maximum cut size the algorithm will use to calculate possible formulas for fragment ions.
2.4 File Import
2.4.1 Import Spectrum
![]() Click this button (or select 'Import spectrum' from the 'File' menu) to import a mass spectrum .csv file.
Click this button (or select 'Import spectrum' from the 'File' menu) to import a mass spectrum .csv file.
![]() Click this button (or select 'Import mol file' from the 'File' menu) to import a structural .mol file.
Click this button (or select 'Import mol file' from the 'File' menu) to import a structural .mol file.
NOTE: A spectrum and a MOL file must be imported in order to calculate the fragment formulas.
2.4.2 Import Library to SQL Database
To convert a library into an SQL database for use with FFC, first click either the  or select 'Import Library to SQL' from the 'Tools' menu. Then select the sdf file that you want to convert. Finally, choose an output directory where the SQL database will be saved. The sdf file will be automatically converted to an SQL database, and a prompt will pop up when the conversion is finished with the number of elements successfully converted.
Any sdf library with the following defined format can be converted to an SQL database:
The first section follows the exact definition of a mol file. After the mol file entry, the following fields are required:
><NAME> - Name of the compound
><SYNONYMS> - Synonyms for the compound, separated by a '#' sign
><FORMULA> - Molecular formula of the compound
><MW> - Molecular weight of the compound
><CASNO> - CAS number of the compound
><ID> - A unique identificaion number for the database
><CONTRIBUTOR> - The source of the entry
><NUM PEAKS> - The number of peaks in the spectrum
><MASS SPECTRAL PEAKS> - A list of peaks in the spectrum in two fields: m/z and intensity, tab-separated
$$$$ - This ends the entry for the compound
An example entry for a compound in an sdf file is given on the website.
NOTE: Once the conversion is finished, the library needs to be set as the active library in the 'Settings' window before it can be queried!
2.5 Calculating Fragment Formulas
2.5.1 Library Search
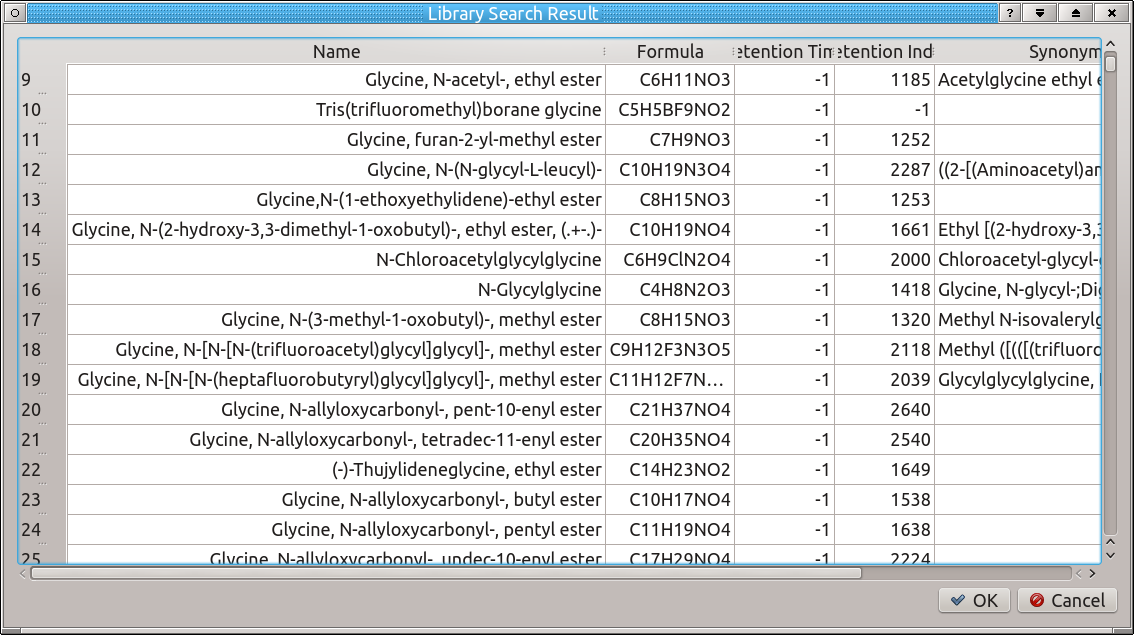
Once a library has been loaded, a compound can be found from the library by its name or molecular formula. Enter either of these into the corresponding fields, make sure the correct radio button is selected, then press ![]() ('Start Library Search'). A result table will appear with a list of matches. Select the desired compound and then press OK to load the corresponding structure and spectrum for further fragment formula calculation.
('Start Library Search'). A result table will appear with a list of matches. Select the desired compound and then press OK to load the corresponding structure and spectrum for further fragment formula calculation.
2.5.2 Selecting Backbone Atoms
For derivatized compounds, to select the atoms belonging to the backbone of the original compound, click the icon in the main window toolbar ![]() (or choose 'Select Backbone Atoms' from the 'Tools' menu). A window with the visualized compound will appear. Click on the atoms which belong to the backbone; a bold box will appear around selected atoms. Selected atoms can be clicked again to deselect them. When all desired backbone atoms have been selected, press OK to return.
(or choose 'Select Backbone Atoms' from the 'Tools' menu). A window with the visualized compound will appear. Click on the atoms which belong to the backbone; a bold box will appear around selected atoms. Selected atoms can be clicked again to deselect them. When all desired backbone atoms have been selected, press OK to return.
2.5.3 Selecting Fragment to Calculate
Once the compound has been selected, the list of fragments for which it is possible to calculate the formula will be automatically generated. Choose the desired fragment in the pull down list 'Calculate Formula for Fragment', and press the 'Start Calculation' (or select it from the 'File' menu; Shortcut CTRL+R). 'Calculation Finished' will appear at the bottom information bar when the algorithm has finished calculating the formulas.
2.6 Results Table
Once the formula calculation is finished, the 'Compound Info' window will automatically switch to the 'Results' tab to show the results.
A list of all calculated fragment formulas is shown, with the following information:
Formula: The molecular formula of the calculated fragments
Score: The score of the match between the predicted mass spectrum versus the measured mass spectrum (the spectrum similarity score)
Backbone Atoms: Atoms from the compound backbone existing in this candidate formula
Average Error: The percent mean difference between the measured and the predicted molecular ion ratios (Mn=M0)
Max Error: The percent maximum difference between the measured and the predicted molecular ion ratios (Mn=M0)
Cut Size: The number of cuts required to create the calculated fragment
Even Electron Ion Loss: Whether or not the fragment is an even electron ion. If this is "No", the fragment is a radical
2.6.1 Exporting Result Table
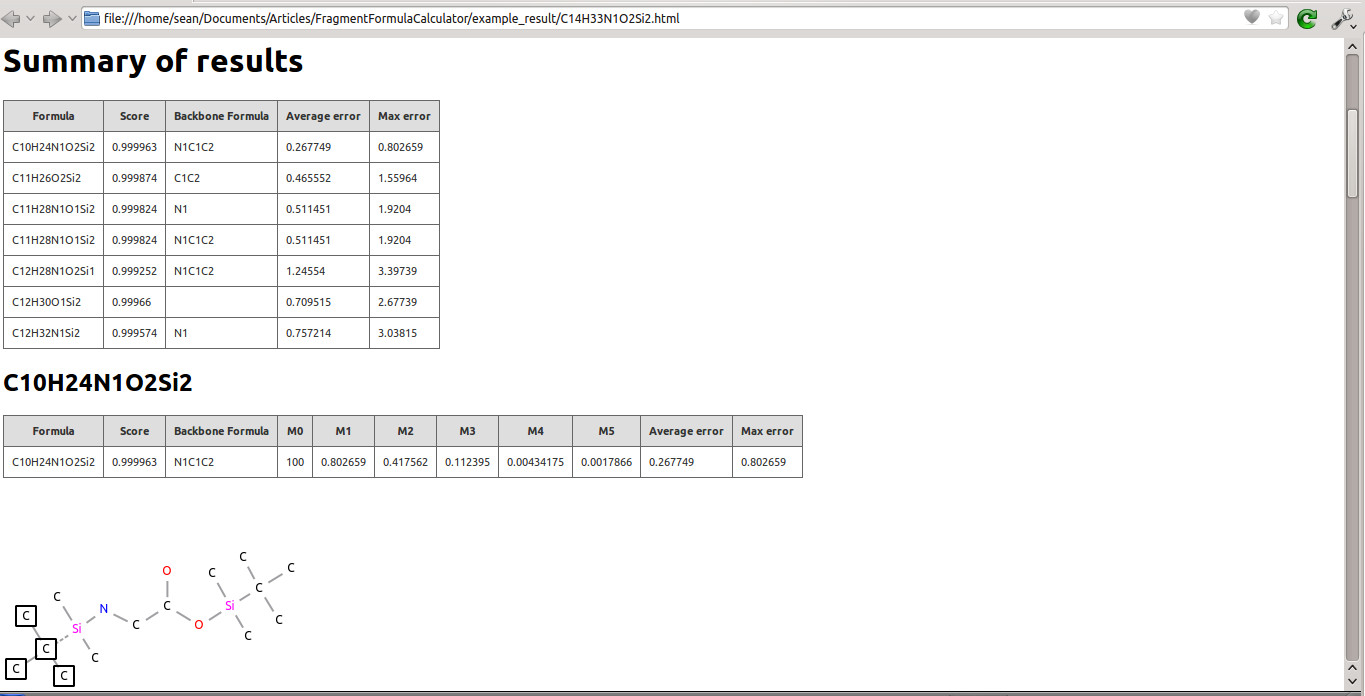
![]() Click this button (or select 'Generate Fragment Report' from the 'Tools' menu) to export the results table (with corresponding structural gures) to an HTML file. The output le contains a summary of results (as listed in the 'Results' tab); for each result, the corresponding psuedostructure with broken bonds and lost atoms is shown. An example is shown in figure 2.
Click this button (or select 'Generate Fragment Report' from the 'Tools' menu) to export the results table (with corresponding structural gures) to an HTML file. The output le contains a summary of results (as listed in the 'Results' tab); for each result, the corresponding psuedostructure with broken bonds and lost atoms is shown. An example is shown in figure 2.
3 Step-by-step Tutorial
In this tutorial we will import a mol file and a spectrum le for TBDMS-derivatized glycine (N,O-bis-(trimethylsilyl)-glycine), using FFC to calculate the proper fragment for m/z 246 in the mass spectrum.
To get started, download the dataset (ffc_sample_data.zip) from the FFC Website, unpack it, start FFC and follow the steps below.
3.1 Start Program, Load mol File and Spectrum File
FFC can be started by selecting All applications -> Education -> Science -> FFC (KDE) or by typing ffc-app on the command line. On Windows select FFC from the Start menu. You will see the main window of FFC when the program starts.
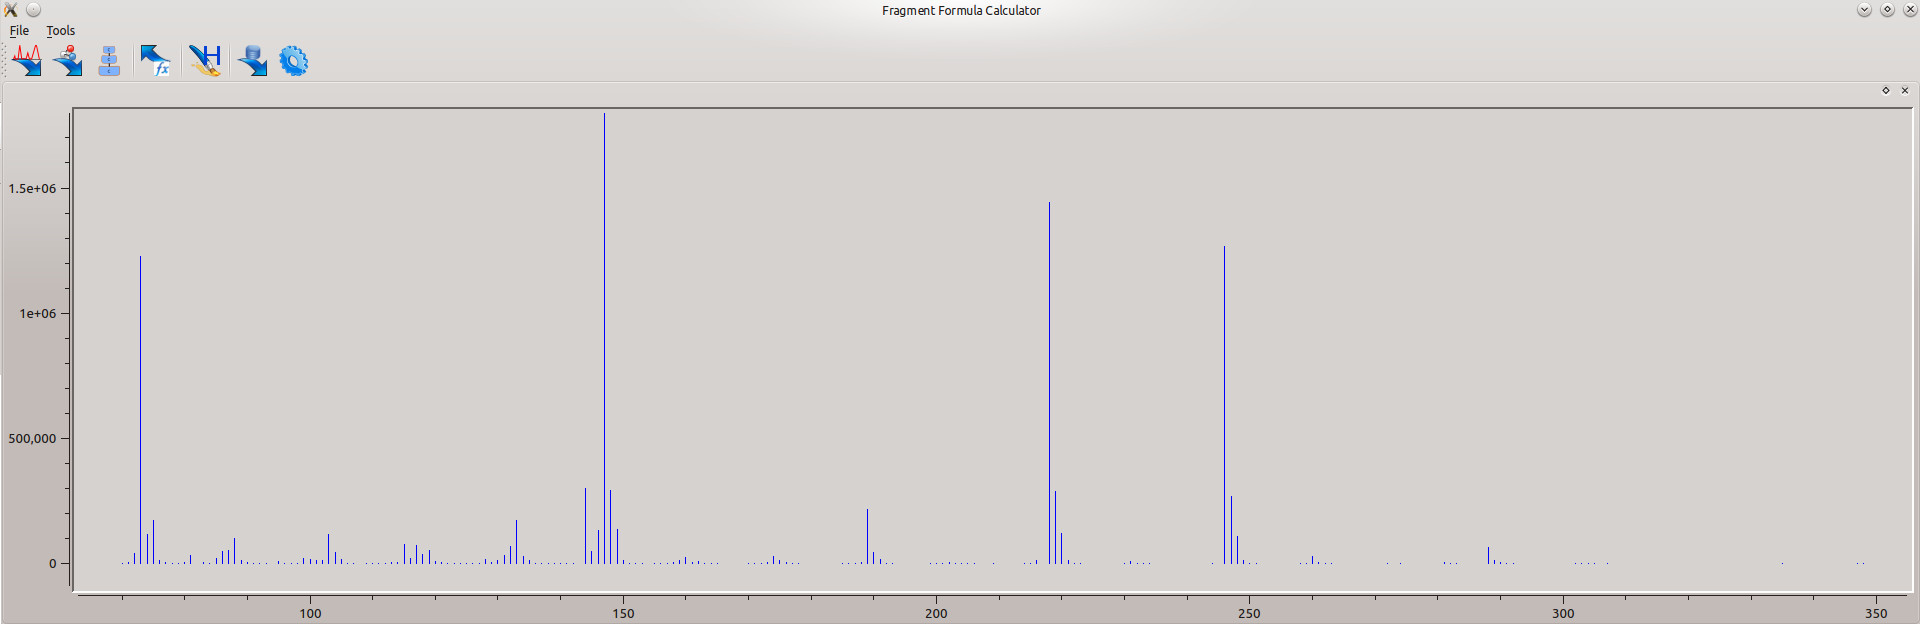
To import the spectrum, click the ![]() icon and browse to the folder containing the downloaded data. Choose 'glycineTBDMS.csv' to load the spectrum. After it loads, you will see the spectrum in the 'spectrum' window (as in Figure 3).
icon and browse to the folder containing the downloaded data. Choose 'glycineTBDMS.csv' to load the spectrum. After it loads, you will see the spectrum in the 'spectrum' window (as in Figure 3).
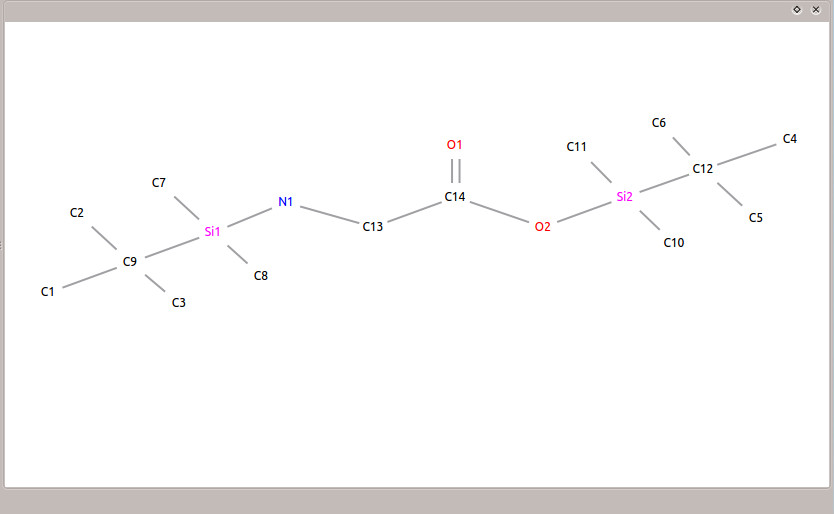
To import the mol file, click the ![]() icon and browse to the folder containing the downloaded data. Choose 'glycine.mol' to load the mol file. After it loads, you will see the structure of N,O-bis-(trimethylsilyl)-glycine in the 'Result Visualization' window (as in Figure 4).
icon and browse to the folder containing the downloaded data. Choose 'glycine.mol' to load the mol file. After it loads, you will see the structure of N,O-bis-(trimethylsilyl)-glycine in the 'Result Visualization' window (as in Figure 4).
3.2 Choose Backbone Atoms
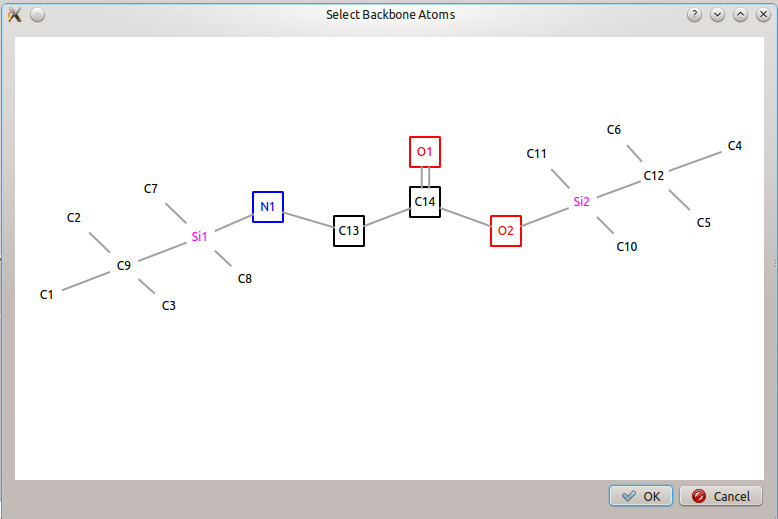
The backbone atoms of the original compound must be selected before calculating fragment formulas, so that the algorithm can differentiate between which atoms come from the compound of interest and which atoms come from the derivatization. Click on  to open the 'Select Backbone Atoms' dialog window, and choose the backbone atoms from glycine (as shown in Figure 5). Click the OK to confirm the selection. The structure in the 'Result Visualization' window will change, and only the backbone atoms will have associated numbers.
3.3 Calculate Fragment Formulas
After the backbone atoms are selected, the formula for each fragment can be calculated. To select which fragment to calculate the formula for, go to the 'Compound Info' window, and select fragment 246 from the drop-down list. Next, click on  to begin the fragment formula calculation. When the calculation is complete, 'Calculation Finished' will be displayed below the 'Compound Info' window. Next, click on the "Result" tab in the "compound Info" window to display the results of the calculation (Figure 6)
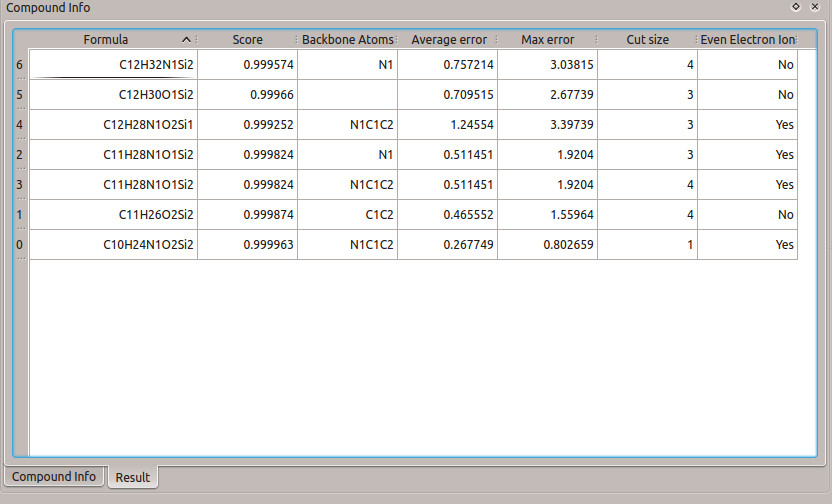
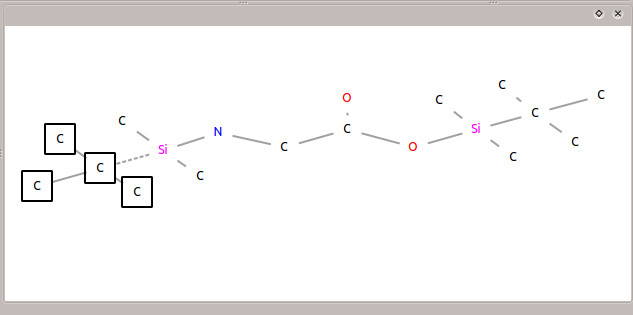
The correct formula for this fragment is C10H24O2NSi2, and this result also is present in the table. It has the highest score, lowest number of broken bonds, and lowest error value. The structure of the fragment can be seen in figure 7. The single cut results in four carbons from the TBDMS being lost, while the entire backbone of the glycine remains intact.
3.4 Choosing Different Backbone Atoms
It is interesting to note that the result is maintained for different backbone atoms chosen. If the main concern is the carbon backbone (without the nitrogen), then the list of results is different than when only the nitrogen backbone is chosen (Figure 8). However, in both of the resulting lists, the correct fragment formula is still the best choice (due to the score, cut size, and error).
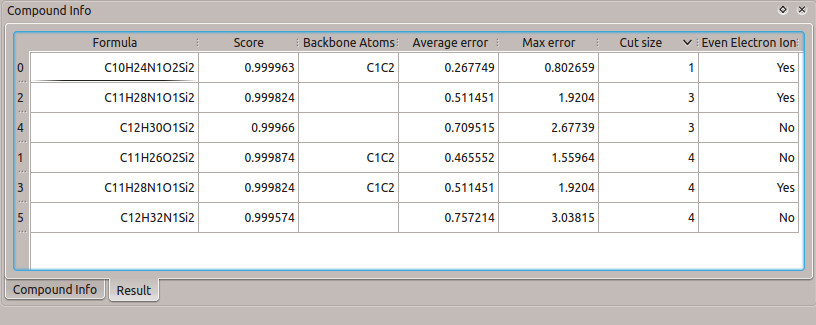
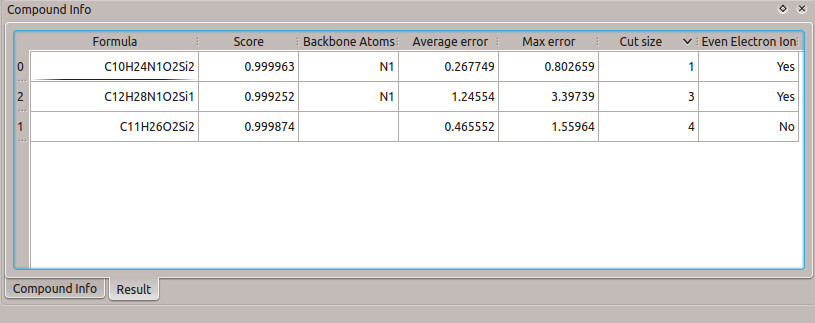
Figure 8: Results table from calculation with different backbone atoms. (a) Only carbon atoms of the glycine molecule are chosen as the backbone. (b) Only the nitrogen atom of the glycine molecule is chosen as the backbone.
3.5 Data Export
To export the results, click on the  icon. A dialog window will pop up, and you can choose a directory to export the results into. The results are exported in HTML format, with the corresponding structural diagram above each fragment result.
Publications
Hiller, K.; Metallo, C. M.; Kelleher, J. K. & Stephanopoulos, G. Nontargeted elucidation of metabolic pathways using stable-isotope tracers and mass spectrometry. Anal Chem, 2010, 82, 6621-6628. [ Pubmed ]
Hiller, K.; Hangebrauk, J.; Jäger, C.; Spura, J.; Schreiber, K. & Schomburg, D. MetaboliteDetector: comprehensive analysis tool for targeted and nontargeted GC/MS based metabolome analysis. Anal Chem, 2009, 81, 3429-3439 [ Pubmed ]
Hiller, K.; Wegner, A.; Weindl, D.; Cordes, T.; Metallo, C.M.; Kelleher, J.K.; Stephanopoulos, G. NTFD--a stand-alone application for the non-targeted detection of stable isotope-labeled compounds in GC/MS data. Bioinformatics, 2013, 29(9), 1226-8 [ Pubmed ]
Wegner, A.; Sapcariu, SC; Weindl, D.; Hiller, K. Isotope Cluster-based compound matching in gas chromatography/ mass spectrometry for non-targeted metabolomics. Anal Chem, 2013, 85, 4030-7 [ Pubmed ]
topScreenshots
top
Weblinks
Related software
- MetaboliteDetector - Deconvolution and Analysis of GC/MS Data
- NTFD -Tool for non-targeted detection of stable isotope labeled ions
Labs
topContact
Andre WEGNER
a.wegner(a)tu-bs.de
Institue for Bioinformatics and Biochemistry
Technische Universität Braunschweig
Braunschweig Integrated Centre of Systems Biology
Rebenring 56
38106 Braunschweig